Metro vs Rural: Breaking Down Price Differences
See actual price gaps for food, housing, and essentials. We’ve compared real costs across major metros and small towns to show you exactly where your money stretches furthest.

Why These Price Gaps Matter
Your salary might look decent on paper. But does it actually stretch further in a smaller town? The short answer: absolutely. A rupee doesn’t have the same purchasing power everywhere, and understanding these differences changes how you plan your budget, career moves, and lifestyle choices.
We’ve analyzed real price data across metros like Delhi, Mumbai, and Bangalore, plus tier-2 cities and rural areas. The numbers reveal patterns you won’t find in generic cost-of-living indexes. Food costs vary wildly. Rent differences are staggering. Even utilities and transport show surprising gaps. Let’s dig into what’s actually happening with prices where you live — or where you’re thinking about moving.

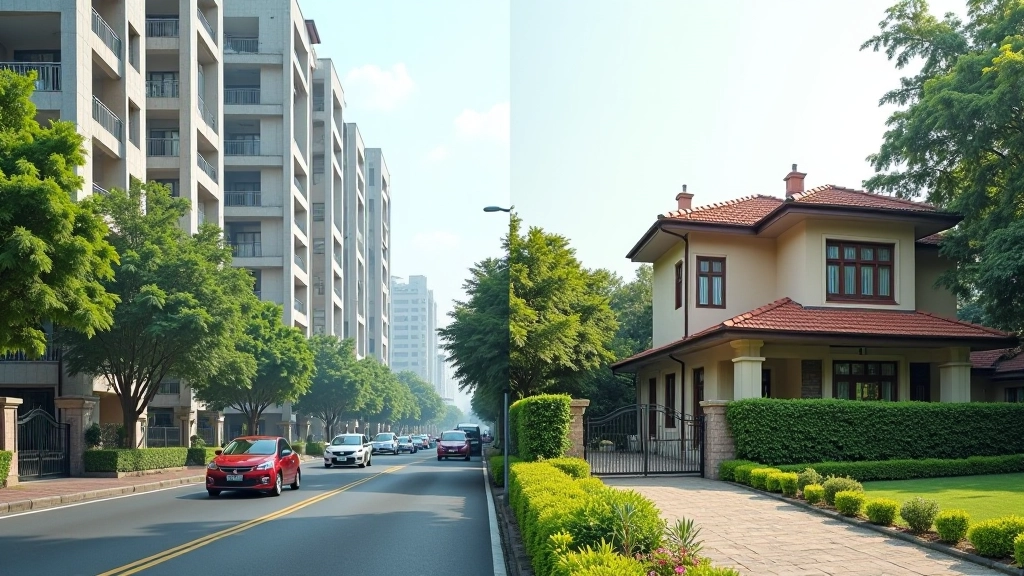
Housing: Where the Biggest Gap Shows Up
This is where price differences become impossible to ignore. In Mumbai, you’re paying 45,000-60,000 monthly for a decent 2-bedroom apartment in suburban areas. In Pune, you’ll find similar space for 25,000-35,000. And in smaller towns like Nashik or Aurangabad? You’re looking at 8,000-15,000 for the same setup.
It’s not just rent. Property prices per square foot tell an even starker story. Delhi’s NCR averages 4,000-8,000 per square foot. But go 100km outside the city into rural areas, and that same square foot drops to 800-1,500. This affects everything — from down payments on homes to property appreciation timelines. Your housing budget in a metro literally becomes 3-4x higher than in a small town.
Food Costs: Daily Expenses That Add Up
Groceries in metros cost noticeably more. A kilogram of tomatoes runs 40-50 in Delhi or Bangalore, but you’ll find them for 15-20 in rural markets. Chicken prices show similar gaps — 180-220 per kilogram in metros versus 120-150 in smaller towns. These aren’t massive individual differences, but they compound over months.
Restaurant meals reveal even bigger contrasts. That 400-500 lunch thali in Mumbai costs 150-200 in tier-2 cities. A coffee you’d pay 150 for at a metro café goes for 40-50 in a small town. If you eat out twice a week, you’re spending an extra 15,000-20,000 annually just by being in a metro area.
Quick fact: Monthly grocery budgets for a family of four typically run 12,000-15,000 in metros, 6,000-8,000 in smaller towns.

Transportation, Utilities & Services: The Hidden Costs
Beyond housing and food, the cost gaps continue. Metro commutes demand either expensive transport passes or personal vehicle maintenance. Auto-rickshaws in metros charge 10-15 per kilometer. In rural areas, you’re often dependent on buses at 1-2 per kilometer, but you might need a two-wheeler or car for any movement at all.
Electricity Bills
Metro households: 2,500-4,500 monthly. Smaller towns: 1,000-1,800 monthly. The difference? Higher rates, more air-conditioning usage, and general premium pricing in urban areas.
Internet & Phone
Broadband plans are similar everywhere (500-800), but reliability varies. Rural areas often have slower speeds or limited options, sometimes forcing you toward expensive satellite internet.
Healthcare Services
Doctor visits in metros cost 500-1,000. In smaller towns, you’re paying 200-400. Specialist consultations show even larger gaps, with metro specialists charging 2-3x more.

Calculating Your Real Purchasing Power
Here’s where it gets practical. Let’s say you earn 60,000 monthly. In Mumbai, after housing (25,000), food (12,000), utilities (4,000), and transport (5,000), you’re left with 14,000. That same 60,000 in a tier-2 city leaves you 28,000-30,000 after the same expenses. Your purchasing power just doubled.
Don’t just look at salary numbers. Calculate what percentage of your income goes toward basics. In metros, you’re often spending 70-80% on housing, food, and transport alone. In smaller towns, that same bundle takes 40-50% of your income. This is the real measure of whether a job offer makes financial sense.
“A 70,000 salary in Bangalore feels like 40,000 in terms of what you can actually save. The numbers don’t lie — the same lifestyle costs dramatically different amounts depending on where you live.”
— Financial analyst comparing metro vs tier-2 city costs
Making Smart Decisions With Price Data
Get Real Numbers for Your Specific City
Don’t rely on averages. Check actual rent listings in your target area, visit local markets for food prices, and ask people about their utility bills. Regional variations within metros matter too — living in Mumbai’s central suburbs costs more than eastern suburbs.
Factor In Hidden Costs You Might Miss
Metros require more spending on clothing for professional environments, frequent dining out due to long work hours, and higher entertainment costs. Smaller towns might require a personal vehicle, increasing transport costs. List everything before deciding.
Compare Salary Increases Against Cost Increases
A 20% salary jump from a smaller town to a metro doesn’t mean a 20% improvement in lifestyle. If living costs jump 40%, you’re actually worse off. Calculate whether the career benefits justify the higher expenses.
The Bottom Line: Know Where Your Money Goes
Metro areas consistently cost 2-3x more for housing, 1.5-2x more for daily expenses, and similar amounts for utilities and services. That 60,000 salary feels different depending on whether you’re in Delhi or a small town in Madhya Pradesh. The difference isn’t trivial — it’s often 15,000-20,000 monthly in actual spending power.
Use this information when making career decisions, planning relocations, or assessing your budget. Don’t just look at salary numbers. Calculate your real purchasing power. Research actual prices in your target location. Ask people living there what they actually spend. Then decide if the move makes financial sense for your situation. The gaps are real, the data is clear, and your wallet will thank you for doing the math first.
Important Disclaimer
The price data and comparisons presented in this article are based on market research and reported costs as of March 2026. Prices vary significantly based on specific neighborhoods, seasons, and individual circumstances. We’ve presented general trends, but your actual costs may differ. Use this information as a starting point for your own research — talk to people living in your target city, check current rental listings, and verify utility rates directly. This content is informational and intended to help you understand cost-of-living concepts, not to provide definitive pricing for any specific location.
Related Guides You Might Find Helpful